
JB Analytica reference architecture — a published example. The business and every figure on it are invented.
Architecture
Every number on this site is built from a synthetic source database by two commands
(uv sync --extra dev, then uv run refarch run --target prod), in four stages, with no
account, no credentials and no server. This page is the short version; the long version is
docs/architecture/README.md
in the repository.
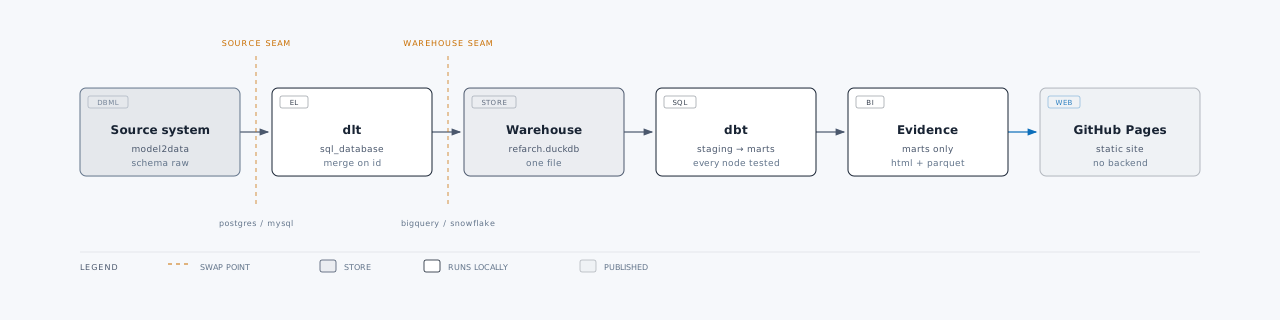
The four stages
| Stage | Tool | What it does |
|---|---|---|
| 1 | model2data | Turns a DBML data model into a relationship-preserving synthetic database |
| 2 | dlt | Extracts it into the warehouse, incrementally, merging on the primary key |
| 3 | dbt | Builds and tests staging → intermediate → marts |
| 4 | Evidence | Builds this report as static HTML and parquet |
The warehouse is a single DuckDB file. dlt writes the raw layer into it,
dbt writes its own schemas back into the same file, and Evidence reads the marts out of it — so
the whole warehouse is one artefact you can open with duckdb warehouse/refarch.duckdb.
The seam
The two dashed lines either side of dlt are the only places this stack changes when it is
pointed at something real. Swap the source for a production Postgres, swap the destination for
BigQuery or Snowflake, and everything from staging upward — every model, every test, every page
on this site — is untouched. That property is the whole reason the repository is shaped this way.
Where the numbers are defined
There is no semantic layer between these pages and the warehouse, so the dbt marts are the
semantic layer. net_amount_eur, realised_net_amount_eur, is_cancelled and
days_to_ship each mean exactly what the mart SQL says they mean, reviewed in a pull request.
A page here may group and sum those columns; it may not redefine them.
Display names fall on the mart side of that line too. The source stores its enums lowercase and
snake_cased — mobile_app, light, cancelled — and each mart carries a label column beside the
raw one, so Mobile app is decided in fct_orders and read by every chart that shows it. A page
that cased its own axis labels would be redefining a value in precisely the way the boundary
exists to prevent, and two pages would eventually disagree about what to call the same thing. The
raw enum stays in the mart as the key to filter and join on; the label is what gets drawn.
That boundary is enforced rather than trusted: only the marts carry dbt's bi tag, and each of
the four source queries behind this site selects from one mart and nothing else.
The distinction the marts care most about is booked versus realised revenue.
net_amount_eur is the order as placed, cancellations included; realised_net_amount_eur is
zero when the order was cancelled. Every revenue figure on this site sums the realised column.
Both are stored per row so both stay additive, and a dbt test pins the pair against the
cancellation flag on every build.
What this data is not
The source is generated, not observed, and it is worth knowing where that shows:
- Cancellation is drawn independently of everything else. It does not correlate with the product, the channel or the month, so the cancellations page can show you the shape of the question but never a real answer to it.
- About one order in nine has no line items at all — 436 of 4,000. Each line picks its order at random and nothing guarantees every order is picked, so empty ones are a statistical certainty rather than a bug: at 9,000 lines over 4,000 orders the expected share is e^(−9000/4000), or 10.5%, and the observed figure is 10.9%. They are real rows with €0 of revenue, so they pull the average order value down about a tenth — €86.70 against €97.24. A production source would not have them.
- Nothing here has been tested against a spike. The series are smooth by construction: there is a trend and an annual cycle, but no Black Friday, no outage, no viral week.
These are limits of model2data, not choices made
here, and the empty orders are staying. Making the generator give every parent row a child would
be wrong far more often than right: 79 of the 600 customers here have never ordered, which is
precisely what a real customer table looks like, and dim_customers.has_ordered exists to say
so. An order is different from a customer only because a webshop will not accept an empty
basket — a rule about one particular relationship that a data model has no way to state. Tuning
does not rescue it either: doubling the lines per order reaches 1.5% empty, at the cost of a
basket size no coffee shop has.
So the artefact stays and is written down here instead. The other two are real gaps someone could close — conditioning one column's distribution on another, and injecting a named anomaly into a timeline — but none of it is hidden in the meantime, because a reference architecture that quietly flatters its own data teaches the wrong lesson.